This is how the Noosa Council will look. Five sitting Councillor have been returned, including Deputy Mayor Frank Wilkie who becomes the next Mayor of Noosa.

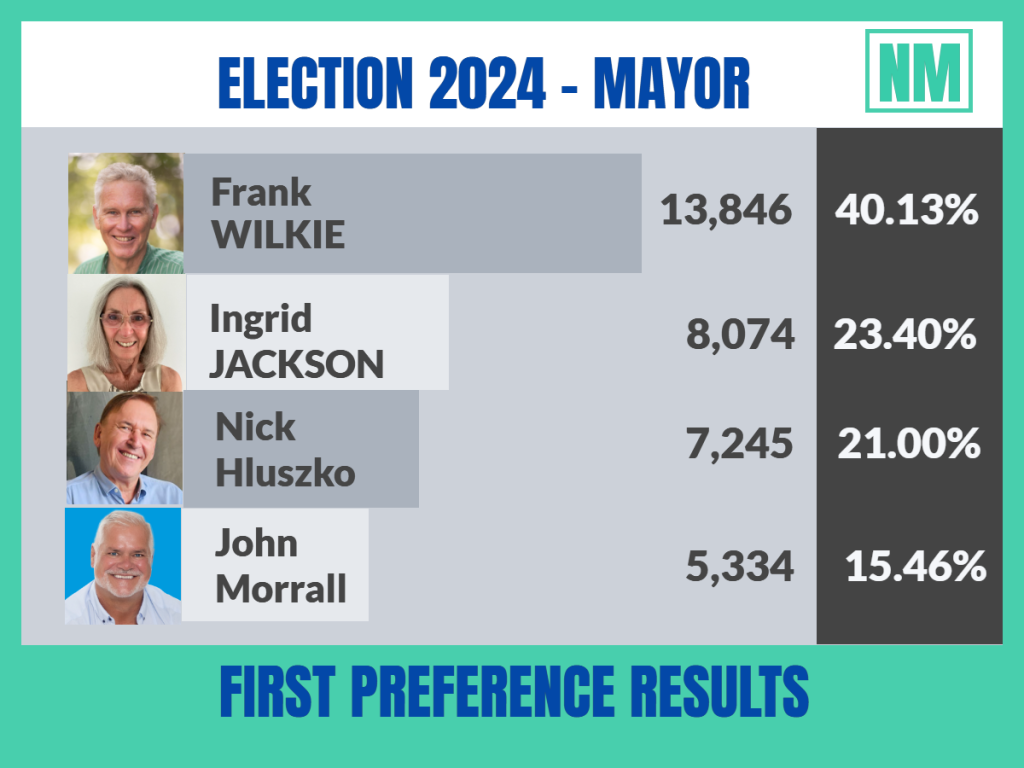
In the end it was an emphatic victory for Frank Wilkie, with just over 40 percent of first preference votes, 5,772 votes ahead of Ingrid Jackson and 6,601 ahead of third placed Nick Hluszko.
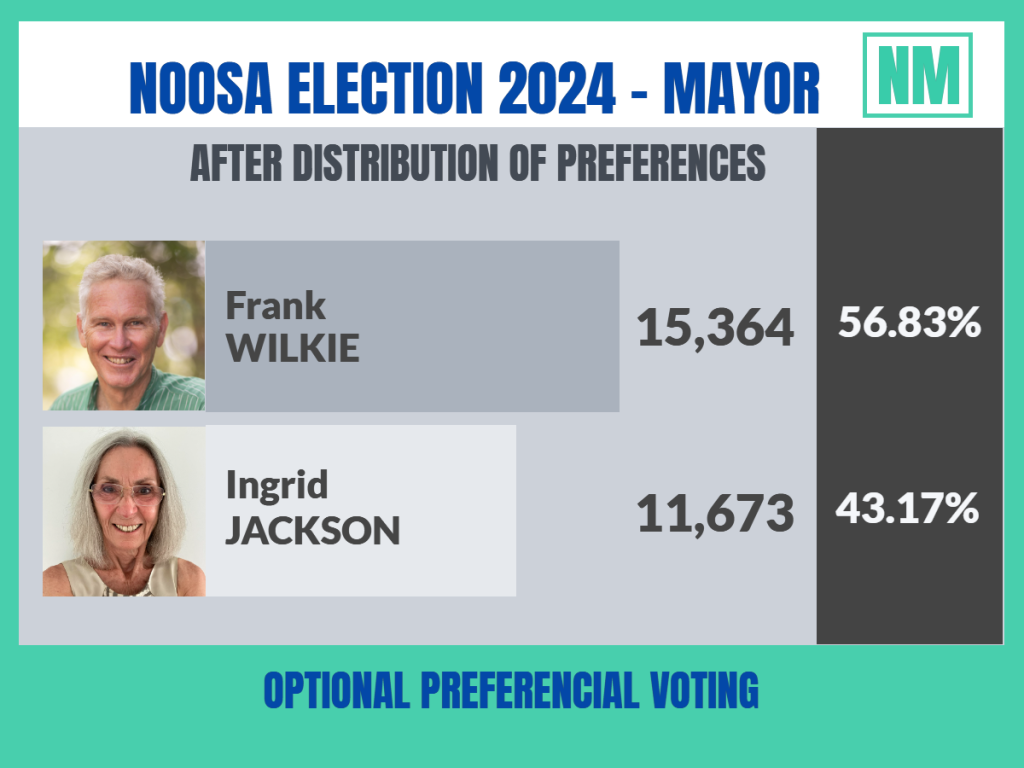
The voting for Mayor was optional preferencial, so many people chose to simply vote for one candidate. This was how it looked after the final distribution of preferences.
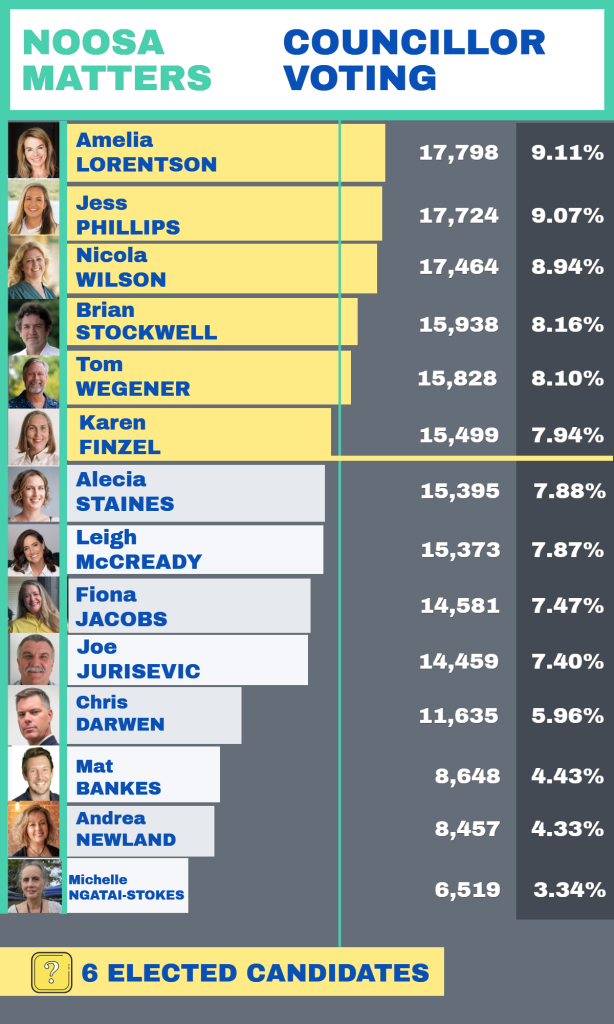
The race for the six councillor places was a fair bit closer.
Sitting Councillor Amelia Lorentson led the count, followed by former police officer Jess Phillips, with financial analyst Nicola Wilson third.
Veteran Councillor Brian Stockwell was re-elected in fourth place, just ahead of fellow Councillor Tom Wegener.
Behind them it was a tight tussle for the sixth spot, with Councillor Karen Finzel just a hundred or so votes ahead of Alecia Staines and Leigh McCready.
Joe Jurisevic – well known for his advocacy of recycling and waste management – will lose the seat in Council he’s held for over 10 years.

This Post Has 4 Comments
So now I’m even more confused. QEC has declared the result, with still only 80 odd % of the vote counted and no update on how the Mayoral preference votes broke. I just don’t understand this system. Can anyone explain?
Just to clarify, the percentages given earlier were percentages of the total number of enrolled electors in Noosa, which is 44,127 people. Despite the fact that voting is compulsory, a number of people still do not vote. The final results tally are all of the formal votes cast in Noosa, excluding informal votes. In other words only about 80 percent of those who could vote did so, and all of those votes were counted.
I’m confused by your percentage of votes counted. The ECQ this morning states “Percentage of enrolled electors counted (for Mayor): 73.47%
Last updated: 7:56 AM on 22 March 2024
Your figure is 80.75%
And for the councillors vote it says “Percentage of enrolled electors counted: 55.48%”
Last updated: 7:56 AM on 22 March 2024
Your figure is 78.96%
Who is right?
You will see at the bottom of our updates a reference to the source – “the unofficial preliminary count”. This count is several thousand votes ahead of the “official first preference” count, which is trickling in more slowly. We will switch over to “official” figures when they catch up, but these are unlikely to vary much from what has already been posted. Mayoral preferences are yet to be distributed.